Basic Usage
Loading sample data
EEMeter comes packages with some simulated sample data.
Note
This data is not to be used for methods testing! It is designed to have obvious (but completely unrealistic) behavior to showcase building temperature response.
See a list of available sample data files, use eemeter.samples:
>>> eemeter.samples()
['il-electricity-cdd-hdd-hourly',
 'il-electricity-cdd-hdd-daily',
 'il-electricity-cdd-hdd-billing_monthly',
 'il-electricity-cdd-hdd-billing_bimonthly',
 'il-electricity-cdd-only-hourly',
 'il-electricity-cdd-only-daily',
 'il-electricity-cdd-only-billing_monthly',
 'il-electricity-cdd-only-billing_bimonthly',
 'il-gas-hdd-only-hourly',
 'il-gas-hdd-only-daily',
 'il-gas-hdd-only-billing_monthly',
 'il-gas-hdd-only-billing_bimonthly',
 'il-gas-intercept-only-hourly',
 'il-gas-intercept-only-daily',
 'il-gas-intercept-only-billing_monthly',
 'il-gas-intercept-only-billing_bimonthly']
Load meter data, temperature data, and metadata, use eemeter.load_sample:
>>> meter_data, temperature_data, metadata = \
...     eemeter.load_sample('il-electricity-cdd-hdd-daily')
>>> meter_data.head()
                           value
start
2015-11-22 00:00:00+00:00  32.34
2015-11-23 00:00:00+00:00  23.80
2015-11-24 00:00:00+00:00  26.26
2015-11-25 00:00:00+00:00  21.32
2015-11-26 00:00:00+00:00   6.70
>>> temperature_data.head()
dt
2015-11-22 06:00:00+00:00    21.01
2015-11-22 07:00:00+00:00    20.35
2015-11-22 08:00:00+00:00    19.38
2015-11-22 09:00:00+00:00    19.02
2015-11-22 10:00:00+00:00    17.82
Name: tempF, dtype: float64
The metadata dict contains simulated project ground truth, such as roughly
expected disaggregated annual usage, savings, and project dates.
Loading data from CSV
Default meter data CSV format:
start,value
2015-11-22T00:00:00+00:00,32.34
2015-11-23T00:00:00+00:00,23.80
2015-11-24T00:00:00+00:00,26.26
2015-11-25T00:00:00+00:00,21.32
2015-11-26T00:00:00+00:00,6.70
...
To load meter data from a CSV, use eemeter.meter_data_from_csv:
>>> meter_data = eemeter.meter_data_from_csv(f) # file handle
The eemeter.meter_data_from_csv has lots of configurable options for
data that is formatted differently! Check out the API docs for more info.
Default temperature data CSV format:
dt,tempF
2015-11-22T00:00:00+06:00,21.01
2015-11-22T01:00:00+06:00,20.35
2015-11-22T02:00:00+06:00,19.38
2015-11-22T03:00:00+06:00,19.02
2015-11-22T04:00:00+06:00,17.82
...
To load temperature data from a CSV, use eemeter.temperature_data_from_csv.
(See also EEweather):
>>> temperature_data = eemeter.temperature_data_from_csv(f) # file handle
The eemeter.temperature_data_from_csv also has lots of configurable
options for data that is formatted differently! Check out the API docs for
more info.
These methods also work with gzipped files (e.g., the sample data):
>>> meter_data = eemeter.meter_data_from_csv(f, gzipped=True)
If frequency is known ('hourly', 'daily'), this will load that data
with an index of the appropriate frequency. This helps the data formatting
methods do the right thing.
>>> daily_meter_data = eemeter.meter_data_from_csv(f, freq='daily')
Creating design matrix datasets
To create a design matrix, use one of the following functions:
eemeter.create_caltrack_hourly_preliminary_design_matrixeemeter.create_caltrack_hourly_segmented_design_matriceseemeter.create_caltrack_daily_design_matrixeemeter.create_caltrack_billing_design_matrix
For example:
>>> meter_data, temperature_data, metadata = \
...     eemeter.load_sample('il-electricity-cdd-hdd-daily')
>>> data = eemeter.create_caltrack_daily_design_matrix(meter_data, temperature_data)
Running Daily and Billing CalTRACK methods
Note
For complete compliance with CalTRACK methods, please ensure that input data meets requirements in section 2.1 of the CalTRACK methods specification and uses settings defined in CalTRACK Compliance.
To run the CalTRACK daily or billing methods, you need a pandas.DataFrame with
the following columns:
meter_value: Daily average metered usage values for each point.cdd_<cooling_balance_point>: Average period daily cooling degree days for a particular cooling balance point.hdd_<heating_balance_point>: Average period daily heating degree days for a particular heating balance point.
For each balance point you want to include in the grid search, you must
provide a separate cdd_<> or hdd_<> column.
Armed with a design matrix of the form created above, you can use
eemeter.fit_caltrack_usage_per_day_model to fit a model.
You may also wish to filter your data to a baseline period or a reporting
period. To do so, use eemeter.get_baseline_data or
eemeter.get_reporting_data. For example:
>>> import datetime
>>> import pytz
>>> datetime.datetime(2016, 12, 26, 0, 0, tzinfo=pytz.UTC)
>>> baseline_data, warnings = eemeter.get_baseline_data(
...     data, end=baseline_end_date, max_days=365)
>>> print(baseline_data.head())
                           meter_value  cdd_70     hdd_60     hdd_61  \
2015-12-27 00:00:00+00:00        25.55     0.0  18.093333  19.093333
2015-12-28 00:00:00+00:00        26.46     0.0  22.478333  23.478333
2015-12-29 00:00:00+00:00        30.38     0.0  25.003333  26.003333
2015-12-30 00:00:00+00:00        49.82     0.0  29.161667  30.161667
2015-12-31 00:00:00+00:00        34.47     0.0  29.572917  30.572917

                           n_days_dropped  n_days_kept
2015-12-27 00:00:00+00:00             0.0          1.0
2015-12-28 00:00:00+00:00             0.0          1.0
2015-12-29 00:00:00+00:00             0.0          1.0
2015-12-30 00:00:00+00:00             0.0          1.0
2015-12-31 00:00:00+00:00             0.0          1.0
CalTRACK Daily Methods
Running caltrack daily methods is easy once you have the data in the right
format. This method returns a eemeter.CalTRACKUsagePerDayModelResults object:
>>> model_results = eemeter.fit_caltrack_usage_per_day_model(baseline_data)
This object can be dumped into a JSON string:
>>> print(json.dumps(model_results.json(), indent=2))
It can be inspected for more detailed information:
>>> model_results.totals_metrics.r_squared_adj
0.7294645737524558
Or plotted (use with eemeter.plot_energy_signature for an overlay on the
fitted data):
>>> model_results.plot()
CalTRACK Billing Methods
Running caltrack billing methods:
>>> model_results = eemeter.fit_caltrack_usage_per_day_model(
...     baseline_data, use_billing_presets=True)
It is essential that the data used in the CalTRACK billing methods is average daily period usage (UPDm) and degree day values.
Data with this property is created by default by the
eemeter.create_caltrack_billing_design_matrix method.
Using the CLI
The CLI can be used to run the caltrack methods directly against CSV data. To allow users without immediate access to data to get started quickly with the eemeter package, the CLI also allow using sample data that comes with eemeter.
Use CalTRACK methods on sample data:
$ eemeter caltrack --sample=il-electricity-cdd-hdd-daily
Loading sample: il-electricity-cdd-hdd-daily
{
  "status": "SUCCESS",
  "method_name": "caltrack_daily_method",
  "model": {
    "model_type": "cdd_hdd",
    "formula": "meter_value ~ cdd_65 + hdd_55",
    "status": "QUALIFIED",
    "model_params": {
      "intercept": 10.733478866990144,
      "beta_cdd": 2.039525988684711,
      "beta_hdd": 1.0665644257451434,
      "cooling_balance_point": 65,
      "heating_balance_point": 55
    },
    "r_squared_adj": 0.7810065909435654,
    "warnings": []
  },
  "r_squared_adj": 0.7810065909435654,
  "warnings": [],
  "metadata": {},
  "settings": {
    "fit_cdd": true,
    "minimum_non_zero_cdd": 10,
    "minimum_non_zero_hdd": 10,
    "minimum_total_cdd": 20,
    "minimum_total_hdd": 20,
    "beta_cdd_maximum_p_value": 0.1,
    "beta_hdd_maximum_p_value": 0.1
  }
}
Save output:
$ eemeter caltrack --sample=il-electricity-cdd-only-billing_monthly \
--output-file=/path/to/output.json
Loading sample: il-electricity-cdd-only-billing_monthly
Output written: /path/to/output.json
Load custom data (see sample files for example format):
$ eemeter caltrack --meter-file=/path/to/meter/data.csv \
--temperature-file=/path/to/temperature/data.csv
Do not fit CDD models (intended for gas data):
$ eemeter caltrack --sample=il-gas-hdd-only-billing_monthly --no-fit-cdd
To include all candidate models in output:
$ eemeter caltrack --sample=il-electricity-cdd-hdd-daily --show-candidates
Understanding eemeter warnings
The eemeter package tries to give warnings whenever a result is less than
perfect. Warnings appear throughout the eemeter and are given in the structure
eemeter.EEMeterWarning.
Each warning has the following structure:
- A ‘dotted’ hierarchical name (
eemeter.EEMeterWarning.qualified_name) summarizing its origin and nature. For example:'eemeter.caltrack_method.no_candidate_models' - A full description of the error in prose
(
eemeter.EEMeterWarning.description). - A set of relevant data about the error, such as limits that were passed (
eemeter.EEMeterWarning.data).
Visualization
Plotting results and models.
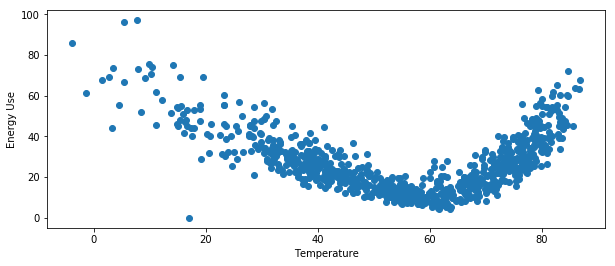
Plot an energy signature (eemeter.plot_energy_signature):
>>> eemeter.plot_energy_signature(meter_data, temperature_data)
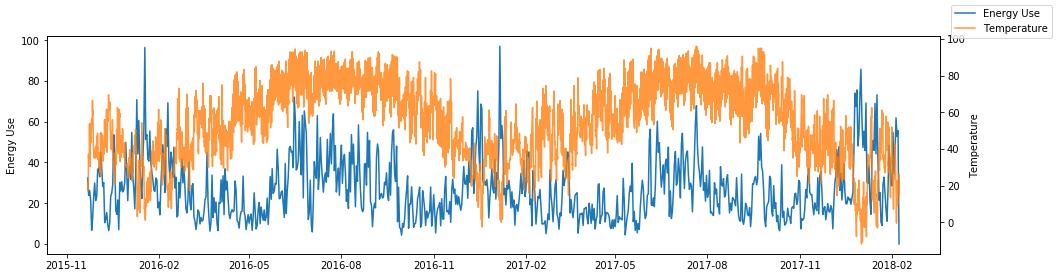
Plot a time series of meter data and temperature data
(eemeter.plot_time_series):
>>> eemeter.plot_time_series(meter_data, temperature_data)
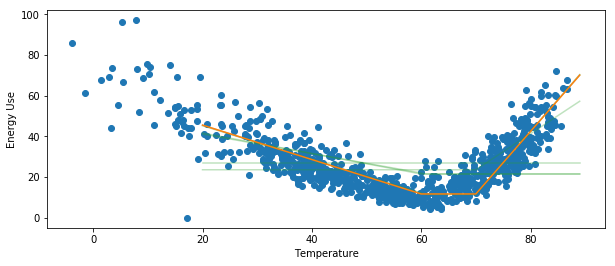
Plot the selected model and all candidate models (eemeter.CalTRACKUsagePerDayModelResults.plot)
on top of an energy signature:
>>> ax = eemeter.plot_energy_signature(meter_data, temperature_data)
>>> model_results.plot(ax=ax, with_candidates=True)
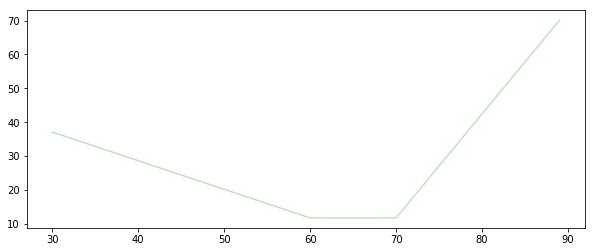
Plot a single candidate model (eemeter.CalTRACKUsagePerDayCandidateModel.plot):
>>> model_results.model.plot()
The plot functions are flexible and can take quite a few parameters, including custom titles, labels, Matplotlib Axes, and color options.
Obtaining weather data
Weather data can be obtained using the EEweather package.
Definitely check out the full docs, but here’s a taste of what that’s like.
Installation:
$ pip install eeweather
Usage:
>>> import eeweather
>>> result = eeweather.match_lat_long(35, -95)
>>> result
ISDStationMapping('722178')
>>> result.distance_meters
34672
>>> station = result.isd_station
>>> station
ISDStation('722178')
>>> import datetime
>>> import pytz
>>> start_date = datetime.datetime(2016, 6, 1, tzinfo=pytz.UTC)
>>> end_date = datetime.datetime(2017, 9, 15, tzinfo=pytz.UTC)
>>> tempC = station.load_isd_hourly_temp_data(start_date, end_date)
>>> tempC.head()
2016-06-01 00:00:00+00:00    28.291500
2016-06-01 01:00:00+00:00    27.438500
2016-06-01 02:00:00+00:00    27.197083
2016-06-01 03:00:00+00:00    26.898750
2016-06-01 04:00:00+00:00    26.701810
Freq: H, dtype: float64
>>> tempF = tempC * 1.8 + 32
>>> tempF.head()
2016-06-01 00:00:00+00:00    82.924700
2016-06-01 01:00:00+00:00    81.389300
2016-06-01 02:00:00+00:00    80.954750
2016-06-01 03:00:00+00:00    80.417750
2016-06-01 04:00:00+00:00    80.063259
Using with Anaconda
Some users find that the easiest way to get a working Python distributions is to use Anaconda (hello Windows users!). Anaconda is a free distribution of Python that comes with all of the dependencies of eemeter and a host of other useful scientific packages.
If that sounds appealing to you, please follow the installation instructions that Anaconda provides, then come back here armed with a shiny new python distribution and install eemeter at an anaconda shell with $ pip install eemeter.
